| The Great Escape has provided an excellent
place for physics classes in Northern New York to apply many
mechanics principles learned earlier in the year to real world
situations...primarily, amusement rides!
This site contains a sampling of graphs of acceleration data collected
using an accelerometer and Vernier CBL. The data was transferred from a
TI-83+ calculator to the program Graphical Analysis on a LapTop during
last years field trip. The graphs are now gif files created in excel and
may be saved or printed for classroom use by right clicking on them. |
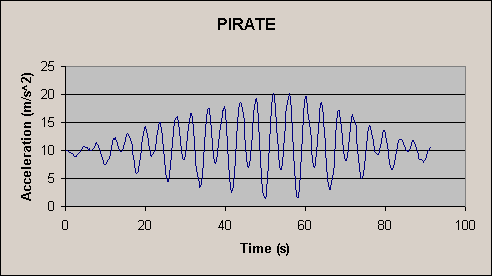 |
The Pirate is a ride in which a pirate ship acts as the bob of a
large pendulum. Riders sit in seats on either side of the pendulum bar.
This graph displays acceleration data for the entire ride cycle. It is
interesting to note that as the acceleration increases (and also the
amplitude) the time for each cycle stays the same.
You can ask students to determine the period and frequency of the pirate ship pendulum from the graph. Also, ask students at which points on the graph is the ship at the bottom of the swing and which points is it at the top. |
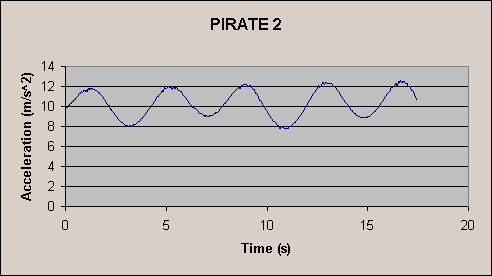 |
This is another trial in which data was collected for a shorter time. A great question to ask students is why the miminmum acceleration varies periodically. Note that the maximum acceleration stays at about 12m/s^2 where as the minimum acceleration fluctuates from 8 to 9m/s^2. The reason is, that it is not possible to sit in the middle of the ship, therefore one gets a better low acceleration feeling when their end of the ship is higher up. |
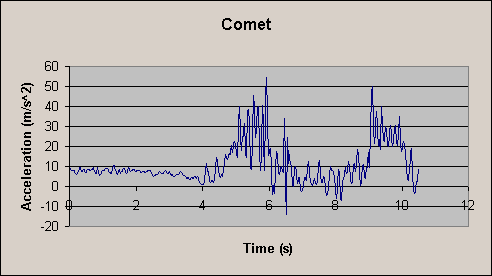 |
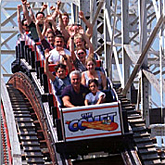 This graph shows the ride as the rider crested the top hill (0-2s) then descended the first and largest drop (2-4s) then experienced tremendous centripetal force up at the bottom of the first hill (5-6s) another drop is encountered before the data ends at 10s. The rapid peaks are a result of the shakiness of the ride. The probe was calibrated so that the rider at rest experiences +9.8m/s^2 |
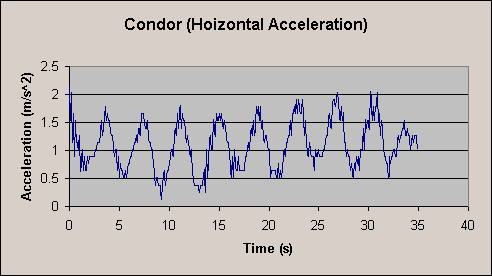 |
On The Condor the rider sits in a large bird that revolves at a constant speed about a point. As the bird rises vertically the point that the bird revolves about begins revolving itself. Due to the low speeds and large radius a relatively low centripetal acceleration is produced. The maximum accelerations are produced when the two revolutions coincide. This effect may be experienced to a greater degree on the Magical Mystery Tour where the same principle is applied. |
| First, type the number you wish
converted here: Then, click radio buttons for desired conversion: | |||||||||
| Fm: | cm/sec |
m/sec |
m/min |
km/hr |
ft/sec |
ft/min |
mi/hr |
Knots |
|
| To: | cm/sec |
m/sec |
m/min |
km/hr |
ft/sec |
ft/min |
mi/hr |
Knots |
|
|
| |||||||||